We use cookies for your comfort
OK

Find out how the end-to-end analytics system
can help your business
and get access to the demo version
can help your business
and get access to the demo version

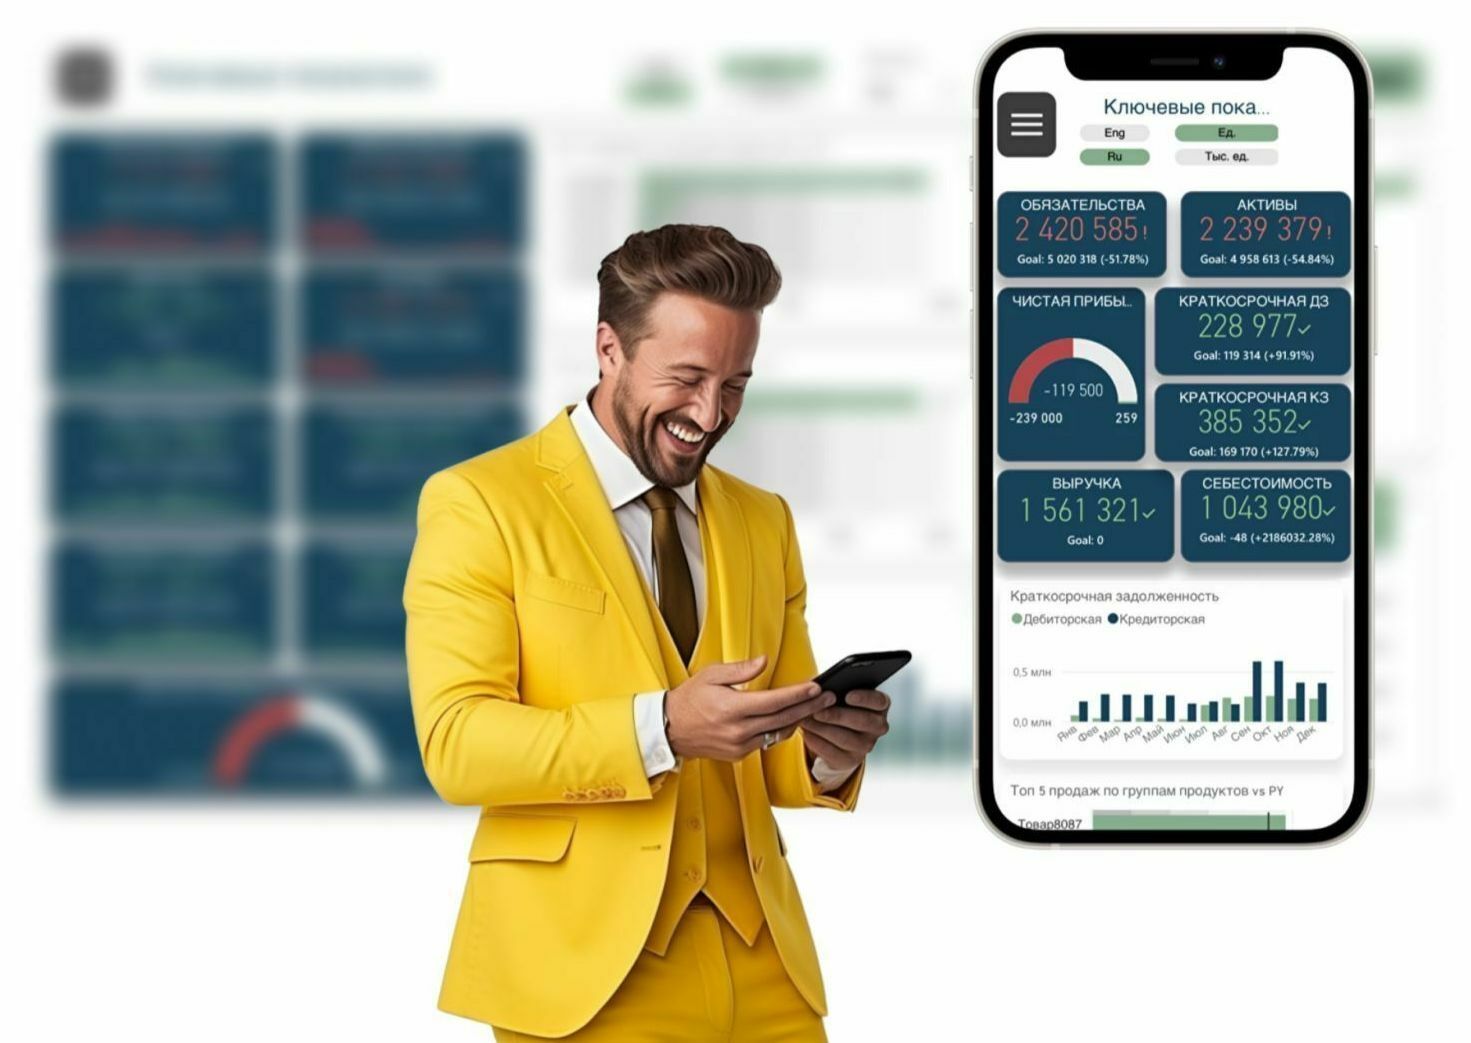
100% transparency of your business anywhere and anytime
Automation
Data visualization
Standardization

100% transparency of your business anywhere and anytime

Order a consultation
You will receive an information letter to the specified email address or a call to the specified number
By submitting your data, you agree to the privacy Policy
Order a call
You will receive a call to the specified number
By submitting your data, you agree to the privacy Policy
Increase the profitability of your business
- Optimize the allocation of resources within the businessInvest in high-performing departments and cut costs in inefficient ones
- Expand your business on timeEvaluate the profitability and growth potential of the business based on clear financial indicators.
- Choose the right solutionsStrategically correct decisions in favor of mergers or acquisitions, based on the financial condition and effectiveness of the potential outcome.
- Distribute capital correctlyCash flow will help you with such solutions as: reinvestment in business, payment of dividends, repurchase of shares
- Eliminate cash gaps in businessMonitor cash flow and make adjustments to ensure that the business has sufficient funds to meet financial obligations
- Manage all risksFor example, diversify your business or increase reserves to be prepared for potential economic downturns.
- Make a budget fasterBuild the right financial forecasts for the financial planning of the organization.
- Set a profitable assortmentThe financial dashboard will help you see which of them are profitable and which are not.
- Compare periodsAn interactive dashboard will allow you to look at all the indicators in comparison with previous periods in order to set goals for the near future.
- Predict salesSales reports will help in analyzing past sales figures and creating accurate sales forecasts for the future, helping to identify trends and make decisions about resource allocation.
- Build a sales strategyUse sales reports to evaluate the effectiveness of current sales strategies and make decisions about which strategies to continue or discontinue
- Identify new market opportunitiesSales reports will help you identify new market segments or show unused ones.
- Achieve maximum performanceDashboards will help you identify all the weaknesses of the sales department
- Manage your sales targetsSales reports will help in tracking progress towards achieving sales targets and making decisions about adjusting targets if they are not met.
Your reports with BiAnalitycs

- Analysis of current assets
- Analysis of current liabilities
- Fixed assets
- Obligations
- Profit and Loss Statement
- Profit analysis by product
- Profit analysis by segment
- Share of expenses in revenue
- Customer analysis by profitability
- Counterparty profitability analysis
- Number of sales
- Analysis of trade turnover

- Sources of sales
- Transaction conversion (sales funnel)
- Lead cost
- Transaction cost
- Transaction cycle
- Analysis of sales by counterparties (clients)
- Analysis of sales by divisions (branches)
- Geographical distribution of sales
HOW IT WORKS?
There is no magic, only technology
Connector 1C
In the standard package, BI Analytics downloads data only from 1C. But it is also possible to connect additional data sources for an additional fee. Such as Excel, CRM systems and others.
Data Storage
Cloud data storage, as well as Microsoft licenses are included in the monthly payment.
In it, we process your data, with a guarantee of complete security and confidentiality.
In it, we process your data, with a guarantee of complete security and confidentiality.
Data Processor
As soon as we receive your data, we will convert it to clear the excess and prepare it for financial calculations.
PowerBI
Based on the received data in a ready-made form, we create their visualizations in the Power BI environment.
Next, you have access to financial dashboards.
Next, you have access to financial dashboards.
smart tips
reports in two languages
100+ adaptive charts
beautiful design
USER-FRIENDLY INTERFACE IN REPORTS
Instantly delve into the value of any indicator from 16 dashboards

Present your reports to foreign investors

Charts are convenient to watch from any screen, they will automatically adjust


The reports are not only made according to all the canons of modern design, but also with an understanding of visual convenience
Reports are available
from any device
from any device
Manage your business from anywhere in the world

ease of interactivity
Historical data analytics
You won't lose old data after switching to BI analytics
Detailing up to the level of the invoice and contract in 1C
There is no need to prepare additional reports on accounts, contracts and counterparties. Dive into the levels below without looking up from the report.

our service is always nearby
Analyst support
Our analysts are among the best in the CIS. They will send you recommendations on indicators 2 times a month according to the format of communication convenient for you. They will indicate indicators that are worth paying attention to, alerts about the approach of cash gaps, tips on indicators that should be increased /lowered, and others.
Learning to use dashboards
We will teach your company how to use dashboards and answer all your questions
Free technical support
As part of the basic tariff, 2 hours of technical support are provided


If you need to generate reports from other data sources, we can connect Excel, CRM systems, advertising cabinets and other 60+ sources.

In addition to financial reports and sales reports, we can also connect HR, marketing, quality control, project management.

We will set up notifications for changes in the indicators you need, so that you don't have to go to the reports every time.

Each employee will have their own login account and access to certain reports. This will increase the security of your corporate data within the structure of your company.

If there is no indicator or it is calculated differently, then you can change the necessary reports.

You can change the colors to suit your corporate design, replace the logo, change the location of charts on dashboards.
advanced functionality
Integration with add. data sources
Preparation of other types of reporting
Configuring Push Notifications
Differentiation of access rights
Customization of indicators and reports
Customization of dashboard design
The system is used by 370 companies of various sizes throughout the CIS

our prices
The rates include the basic services mentioned above
$ 2 003
240 000 ₽
3 months
6 months
10 months
1 year
₸ 720 000
$ 4 005
₸ 1 440 000
$ 6 675
₸ 2 400 000
$ 6 675
₸ 2 400 000
480 000 ₽
120 000 ₽
400 000 ₽
400 000 ₽
The price for the Finance block for 3 months is 120,000 rubles or 954,424 tenge or $2,003
The price for the Finance block for 6 months is 240,000 rubles or 1,908,847 tenge or $4,005
The price for the Finance block for 1 year is 400,000 rubles or 3,181,413 tenge or $ 6,675
The benefit is 17%
The benefit is 17%
Price per block "Finance + Sales" for 10 months - 400,000 rubles or 3,181,413 tenge or $ 6,675
$ 2 003
240 000 ₽
3 months
6 months
10 months
1 year
₸ 720 000
$ 4 005
₸ 1 440 000
$ 6 675
₸ 2 400 000
$ 6 675
₸ 2 400 000
480 000 ₽
120 000 ₽
400 000 ₽
400 000 ₽
The price for a block of "Sales" for 1 year is 400,000 rubles or 3,181,413 tenge or $ 6,675
The benefit is 17%
The benefit is 17%
The price for a block of "Sales" for 10 months is 400,000 rubles or 3,181,413 tenge or $6,675
The price for a block of "Sales" for 6 months is 240,000 rubles or 1,908,847 tenge or $4,005
The price for the "Sale" block for 3 months is 120,000 rubles or 954,424 tenge or $2,003
$ 3 505
420 000 ₽
3 months
6 months
10 months
1 year
₸ 1 260 000
$ 7 004
₸ 2 520 000
$ 11 681
₸ 4 200 000
$ 11 681
₸ 4 200 000
Price per block "Finance + Sales" for 3 months - 210,000 rubles or 1,670,242 tenge or $ 3,505
Price per block "Finance + Sales" for 6 months - 420 000 rubles or 3 340 484 tenge or 7 004$
Price per block "Finance + Sales" for 10 months - 700,000 rubles or 5,567,472 tenge or $ 11,681
840 000 ₽
210 000 ₽
700 000 ₽
700 000 ₽
Price per block "Finance + Sales" for 1 year - 700,000 rubles or 5,567,472 tenge or 11,681$
The benefit is 17%
The benefit is 17%
if basic services are not enough for you
You can buy packages of additional hours of advanced functionality development
As part of the additional development, we can implement the following
To implement the extended functionality, you need to buy additional development hours once
Dashboard customization
From 2 hours
Configuring Push Notifications
From 5 hours
Customization of indicators
From 30 hours
Integration with other data sources
From 40 hours
Differentiation of access rights
From 8 hours
Preparation of other types of reporting
From 60 hours
ANSWER 6 QUESTIONS AND
get access to the demo version of the dashboard
get access to the demo version of the dashboard
At the end of the survey, you will receive a Demo version!
ANSWER 7 QUESTIONS AND GET A GIFT FROM ASPEX
Thank you!
If you need turnkey BI analytics integration
We will develop an individual analytics system and solve non-standard tasks
creating the necessary infrastructure for data collection and processing
working with your business indicators
We have experience in implementing end-to-end analytics in 14 sectors of the economy.
Contact us to learn more about this service!
The development process will include:
answers to questions
If you have not found a question of interest in the list,
call us and we will advise you
call us and we will advise you
Our numbers:
+7 (495) 291-07-85 (Russia)
+7 (771) 853-53-53 (Kazakhstan)
Lukoil Belarus, Mangustaimunaigas, Total, RC Brands, Forte Bank, FHB (First Heartland Bank), St regis
Implementation of end-to-end analytics takes 48 hours. Depending on the provision of access to data, the timing may vary. The client receives all ready-made dashboards and analytics immediately after connection, there is no need to wait.
We do not store your data on our servers. The data is uploaded to a folder next to 1C. All data is stored by the customer (you). All calculations will take place in Microsoft cloud services and will be displayed on the web in the form of dashboards in formats for PC and smartphone. Data security is provided by Microsoft, access to data is carried out using two-factor authentication. APEX is a certified Microsoft partner and has all rights and access to Microsoft services.
We can develop an individual report (dashboard). It is necessary to coordinate the TOR and the prototype of the future report for the development team. This service is calculated individually based on the complexity of the report.
In addition, we collect feedback from each user of the service in order to identify the most relevant changes in the product. Then the users themselves vote for the update options. The development team takes the proposals of the winner of the vote into work and implements them in BI Analytics. Each update, along with new products, is available to every user.
In addition, we collect feedback from each user of the service in order to identify the most relevant changes in the product. Then the users themselves vote for the update options. The development team takes the proposals of the winner of the vote into work and implements them in BI Analytics. Each update, along with new products, is available to every user.
Bioanalytics is a subscription service with a standardized set of dashboards. In turn, the full implementation of end-to-end analytics implies the development of individual dashboards and an analytics system for your company. Implementation takes an average of 1-2 months, after the end of development, you will receive ownership of the analytics and reporting system for your business.
BIanalytics
End-to-end analytics automation for business
Contact us on messengers and social networks
+7 (771) 853-53-53
(Kazakhstan)
(Kazakhstan)
EMAIL: SALES@ASPEX.KZ
INN: 366520387129/PSRN: 313366831700066
Privacy Policy
INN: 366520387129/PSRN: 313366831700066
Privacy Policy